
Population pyramids, which show the age and sex distribution of any country, help us understand how demographic transition plays out and speculate about its medium-term economic prospects. Let’s takes a look at the pyramids for India and China and their implications.
How should we read these pyramids?
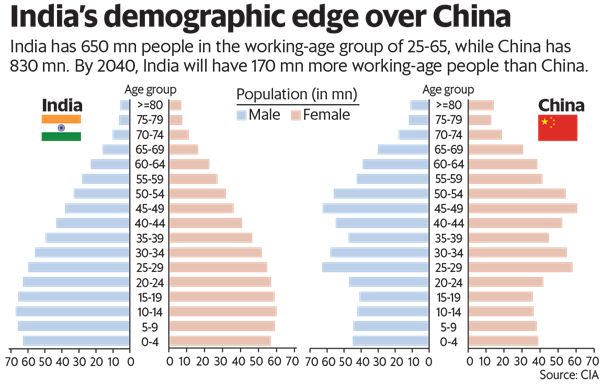
Generally, males are shown on the left-hand side and females on the right. Also, the convention is that age distribution is done in cohorts of five years, with the age rising as we go vertically upwards. The pyramid shape changes over time due to births, deaths, and net migration. A quick look above shows that India’s pyramid, like the actual pyramids in Egypt, is bottom-heavy. That is, the Indian population has a larger proportion of children, teenagers, and young adults compared to China’s. We can also observe that except for the oldest groups, India seems to have more males than females for every cohort.
What do they say about demographics?
India’s population for the age cohorts of 0–4, 5–9, 10–14, and 15–19 is roughly equal, whereas the numbers for older groups become progressively smaller. This means that the country’s younger age groups have stopped growing in numbers now and are likely to shrink slightly soon. This, however, does not mean that India’s population will also start shrinking soon — far from it. On the other hand, China’s largest cohort is in its late 40s, although it is more gender-balanced than its younger cohorts, suggesting that sex-selective abortions are likely to have taken off in the last few decades.
What does this have to do with economic growth?
If we take the 25–65 age group, India currently has around 650 million people and China 830 million. By 2040, India is likely to reach 900 million, whereas China will have around 730 million. In other words, India will go from having 180 million fewer working-age people than China today to about 170 million more — a net gain of a third of a billion in 20 years.
Is demography destiny then?
Just having people in the working-age is not enough. How many are in the labor force and their productivity is important? People pursuing education and home-makers are mostly the ones to drop out of the labor force, women more so. But after a fall in female labor force participation for 10 years or so, there are early signs of improvement. On productivity, Indians about to enter the 25+ age group have almost universal literacy across both genders and many are “digital natives” even in lower-income groups.
What’s the implication of this for India?
The Indian state has to invest more, and efficiently, in human capital and infrastructure. For the former, investments in education, health, and sanitation have to be sustained and more PPP models such as vouchers and charter schools in basic education have to be explored so that tax outlays result in higher outcomes. For the latter, a bigger push for affordable rental housing in cities has to be considered, along with more investments in rail/air connectivity within Tier2 and Tier3 cities.